Benefits of SAP Enterprise Mobility Solution
The mobile landscape has completely changed in the UK. Enterprise Mobility is the new buzzword. It is a technology that gives...
Enormous quantities of data go unused or underused today, simply because people can t visualize the quantities and relationships within the data. As businesses collect more and analyse more and more data, decision makers at all levels need data to be presented visually in a way that enables them to see analytical results presented in a way they can understand, find relevance among the millions of variables, communicate concepts and hypotheses to others, and even predict the future.
We all relate to the saying ’a picture paints a thousand words’ and so if we can present data in a manor we can relate to, it is easier to understand what the data is telling us.
Data visualisation is the presentation of data in a pictorial or graphical format. For centuries, people have depended on visual representations such as charts and maps to understand information more easily and quickly.
Did you know?
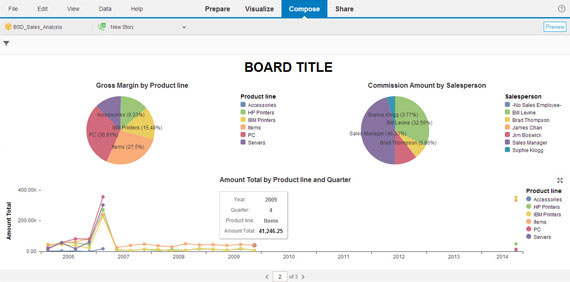
SAP Lumira and SAP Crystal Dashboard Design are some of the tools used for data visualisation. These tools allow businesses to analyse data and share insights easily by creating beautiful and interactive maps, charts, and infographics. You can easily combine data from different sources, visualise it, analyse trends and thus get insights for future planning.
Bring your data to life with SAP Lumira – data visualisation software that makes it easy to create beautiful and interactive maps, charts, and infographics. Import data from Excel and many other data sources, perform visual BI analysis using intuitive dashboards, and securely share insights and data stories with your team.
SAP Lumira is a self-service, data visualisation application that enables businesses to visualise the massive amounts of data available to drive immediate business outcomes. It offers the fastest and the most engaging ways to get answers from your data. SAP Lumira is wherever you need it, be it on the Desktop, Server or Cloud, enabling better-informed, data-driven business decisions right away!
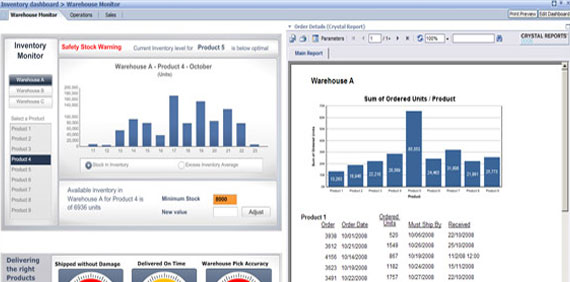
SAP Crystal Dashboard Design enables the creation of insightful and alluring dashboards from any data source with point-and-click ease. You can take control of your complex data and give it a meaning through this tool. You can easily turn your raw data into intuitive and interactive dashboards, thus helping you get a thorough understanding of your data.
At Silver Touch we can help you boost your Business Growth. We specialise in providing end-to-end SAP Business One and SAP HANA solutions that will enhance business efficiency and improve ROI, resulting in increased business growth. We deliver end-to-end SAP Lumira and SAP Crystal Dashboard Design implementation and customisation services. We can help you to meet your SAP Business One analytics needs through the use of these tools, which will facilitate improved decision-making and obtain a better ROI.
Please get in touch with us to find out more. Call us on +44 – (0) 203-872-5140 or email us at info@silvertouchtech.co.uk

An experienced business leader, heads the UK operations of Silver Touch Technologies Ltd. With 15 years of experience in the industry, he has set the track record of delivering transformation and revenue growth with SAP Solutions.